Translation note: This English version was translated by Codex (GPT-5) on 2026-04-20 18:01:46 CST. The source text is the corresponding Chinese post in this repository.

Summary: This article uses a recent public mutual-aid spreadsheet to structurally analyze and visualize missing-person cases related to Myanmar scams.
Star Home: Data Analysis of Myanmar Scam-Related Missing Persons (LLM Assisted)
Summary: A concise profile of victims and regional distribution based on a public mutual-aid archive.
Author: Cao Yueyang
Affiliation: Department of Data and Systems Engineering, The University of Hong Kong
Role: Independent analyst (data collection, labeling, visualization, reporting)
Contact: andy.caoyueyang[at]gmail[dot]com
Time: January 2025
1. Goals and Conclusions
Using a public “Star Home” mutual-aid archive, I extracted structured information and quickly summarized the reasons, time distribution, geography, and demographic profile of the missing persons. The project also tested the efficiency and cost advantages of LLM-assisted labeling for small-scale social issues.
Data source and compliance
- Source: a public Excel sheet collected on 2025-01-14
- Processing: aggregation and anonymized presentation only; no personally identifiable information was included
- Usage note: for public-interest and research discussion only
Key findings
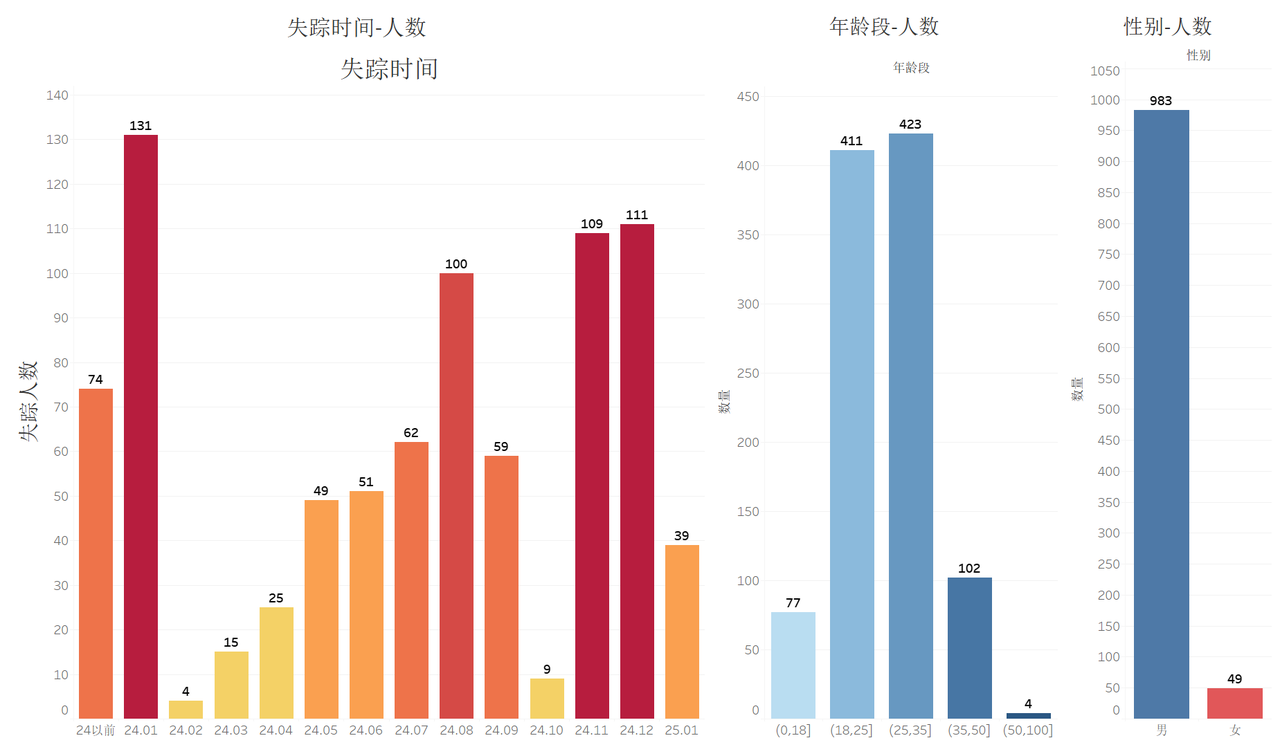
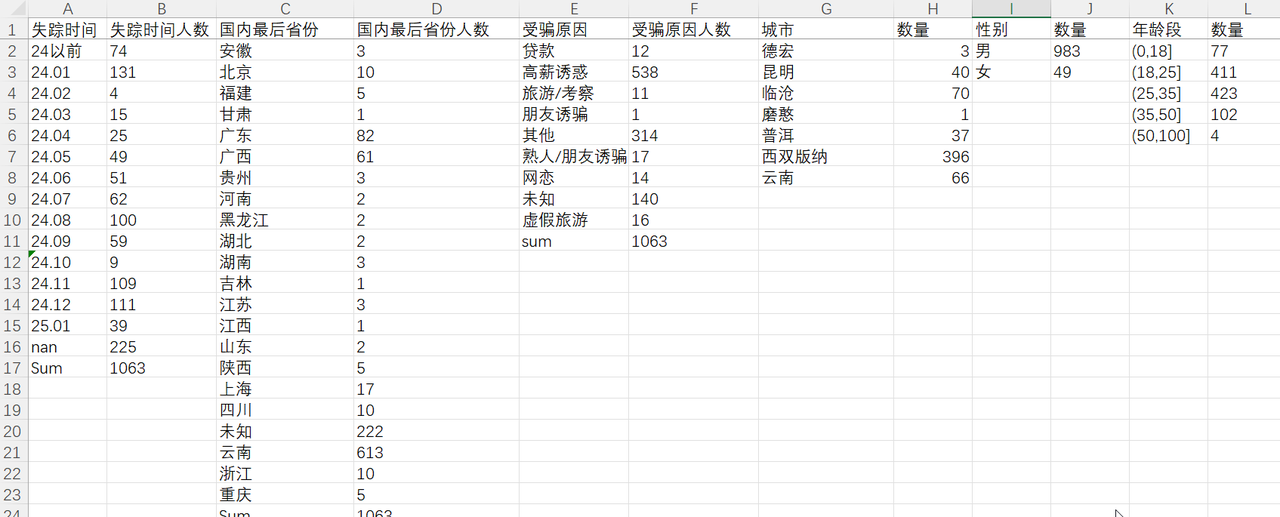
- Profile: 95% male; 80% between 18 and 35
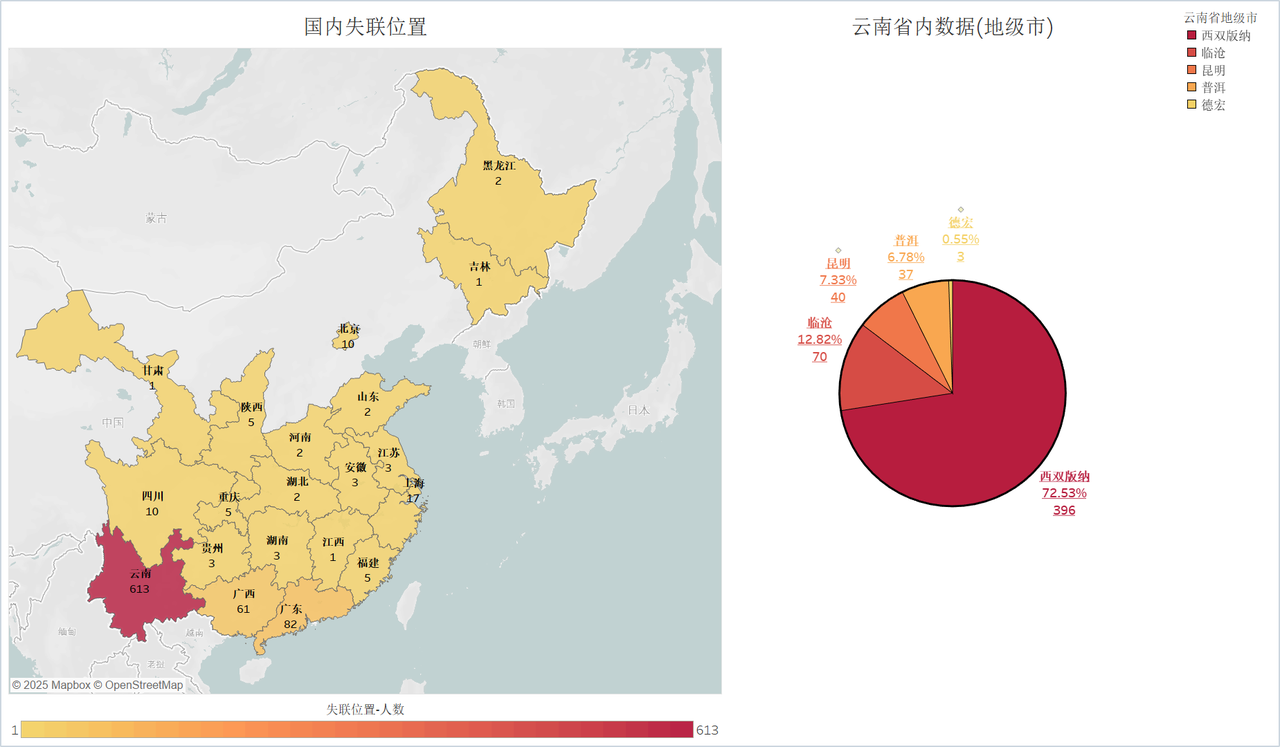
- Geography: 613 records from Yunnan, with 72.53% concentrated in Xishuangbanna
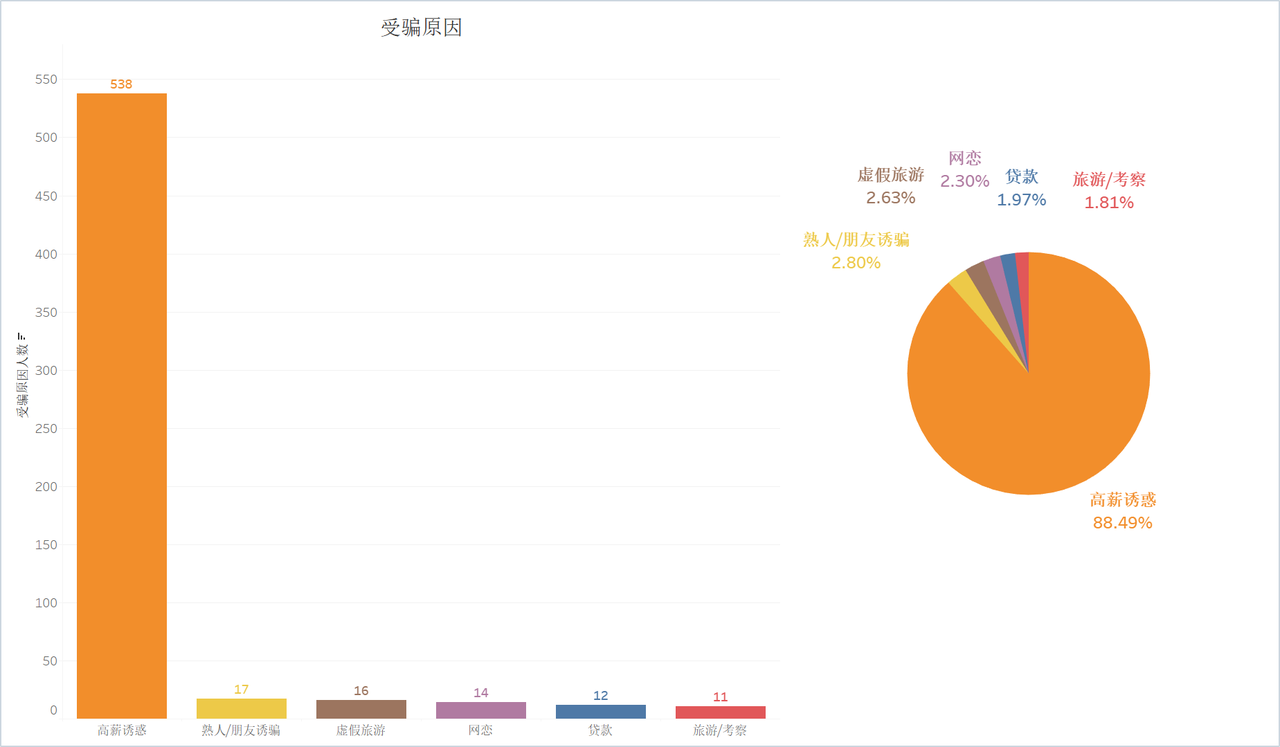
- Cause: 88.49% were lured away by “high salary” promises
2. Project Overview
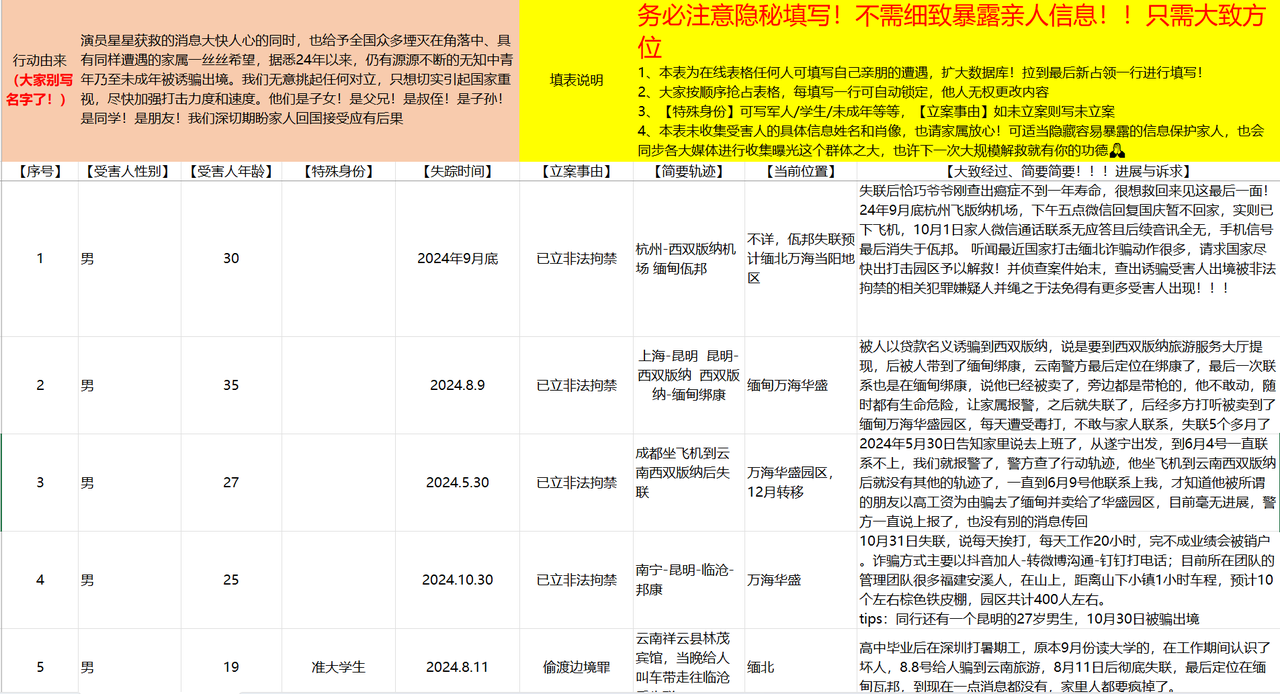
On 2025-01-14, after the widely discussed “Wang Xing was tricked into Thailand” incident, a public online document called the “Star Home Mutual-Aid Archive” circulated online. I downloaded it and carried out an independent exploratory analysis.
Analysis method
- Data cleaning (Python)
- Read the Excel file with
pandas - Removed redundant columns and normalized dates to a
YY.MMformat - Exported the result into a structured TXT file for copy-paste into the LLM
- Read the Excel file with
- LLM-assisted labeling (Gemini Web)
- Pasted the TXT data into Gemini Pro 2.0 in batches
- Prompted the model to return fields such as cause, time, and region
- Iterated until the output was CSV-friendly
- Statistics and visualization (Excel + Tableau)
- Used Excel for counting and filtering
- Used Tableau for maps, bar charts, and pie charts
Method summary
- Strength: flexible, low-cost, and fast for small public-interest datasets
- Limitation: some ambiguity and occasional hallucinations, so human review is still needed
3. Full Workflow
Step 1: Local data cleaning
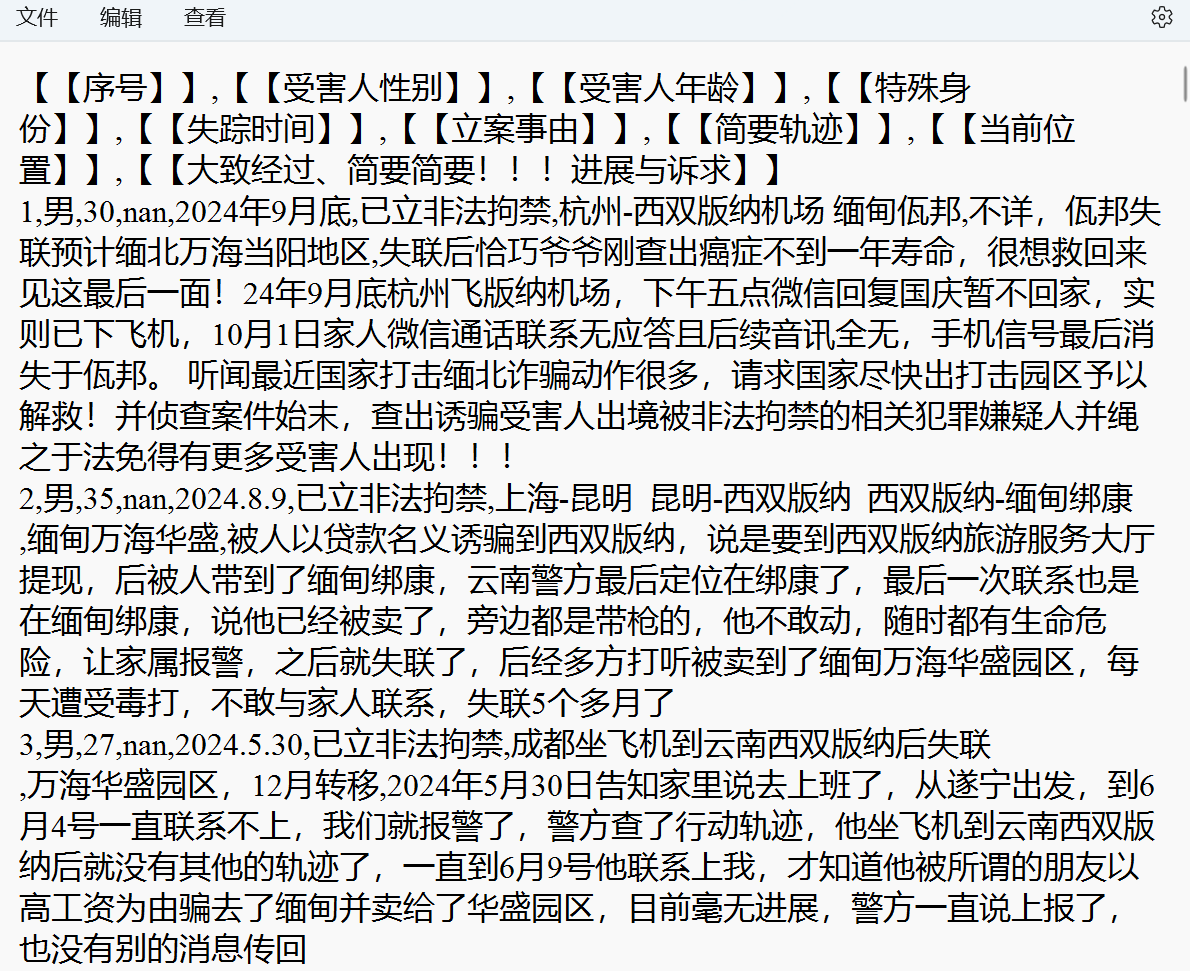
I first exported the Excel sheet into a TXT file with commas so it could be pasted into the LLM more easily.
1 | import pandas as pd |
Step 2: LLM labeling
I pasted the text into Gemini Pro 2.0 and repeatedly refined the prompt until the results could be exported as CSV.
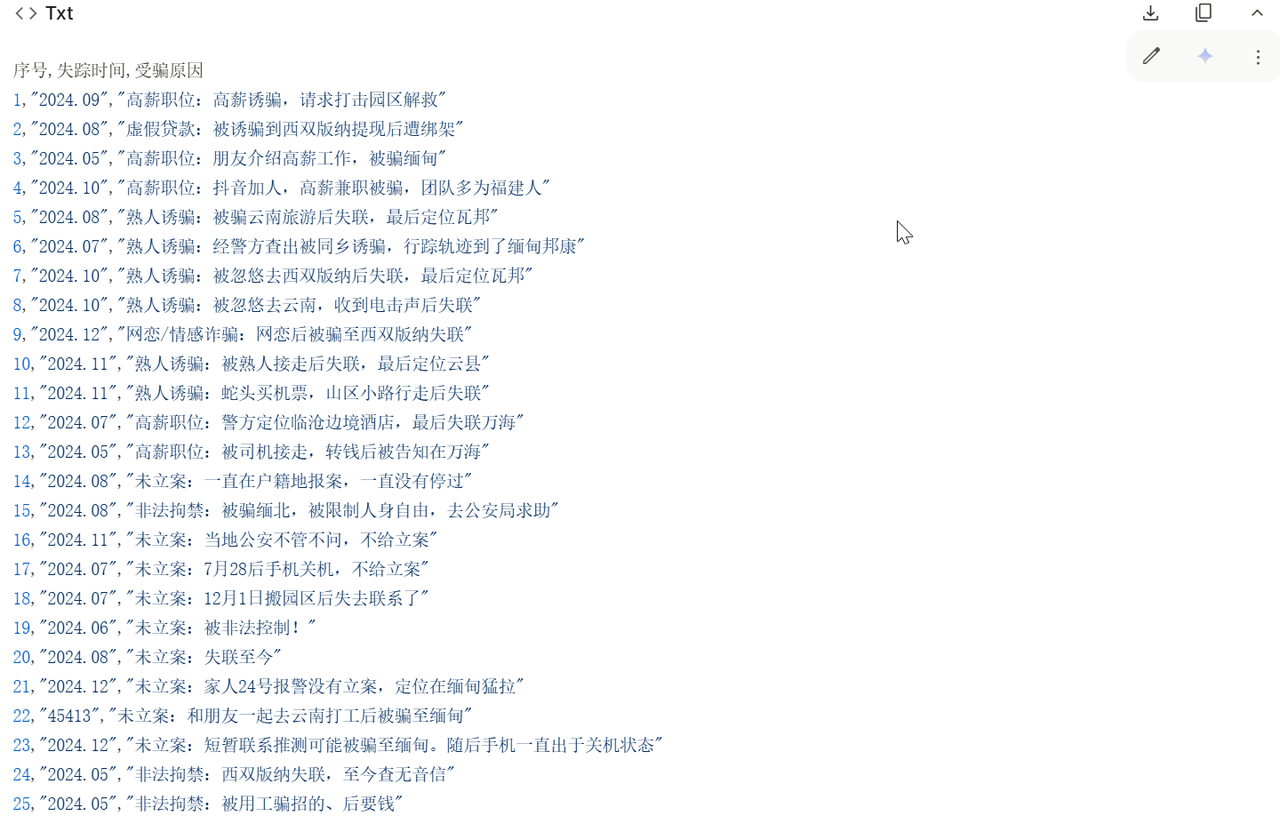
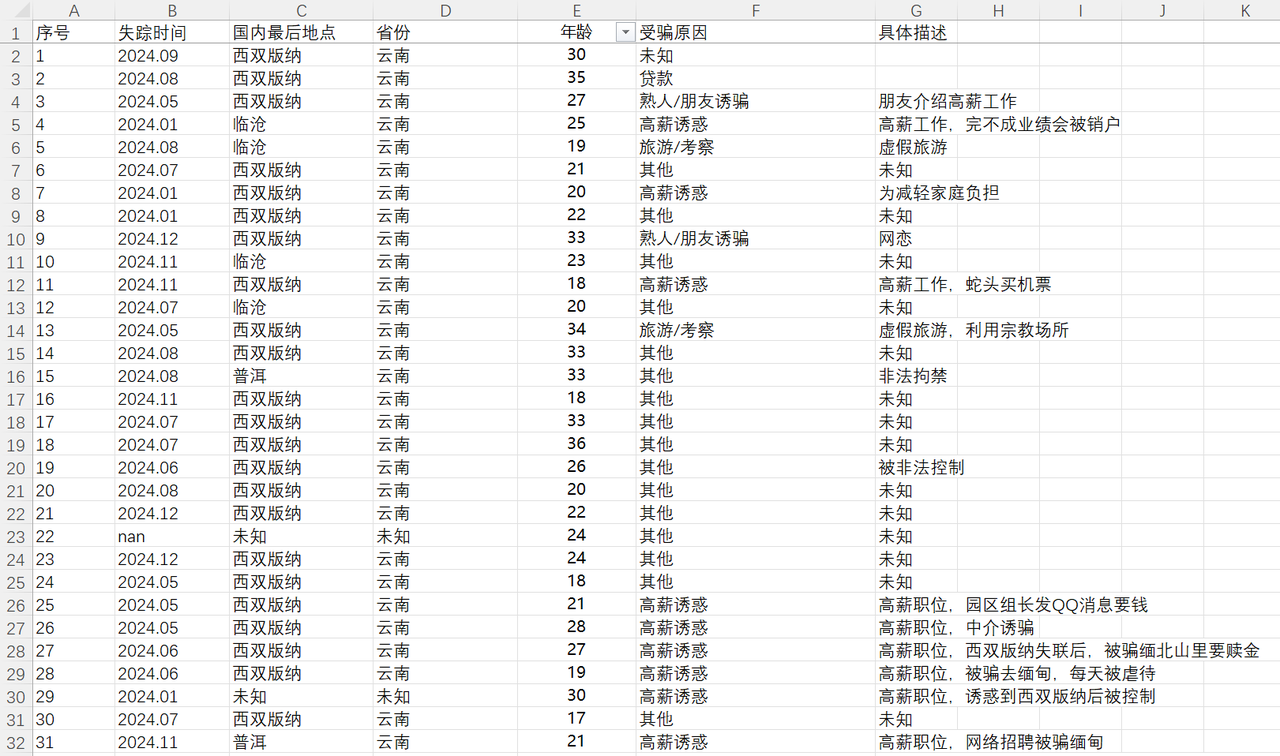
The same approach was used to obtain time, city, age, and cause labels. After that, the results were consolidated into Excel:
Step 3: Tableau visualization and conclusions
I used Tableau to make the data easier to read and to summarize the final patterns.
Typical profile: 95% male, 80% aged 18–35, 72.53% in Xishuangbanna, and 88.49% lured away by high-salary offers.